

B2C E-COMMERCE
E-commerce includes various forms according to the parties involved in the transactions: business-to-business (B2B), business-to-consumer (B2C), business-to-government (B2G) and consumer-to-consumer (C2C).
Business-to-consumer e-commerce
In a large range of countries, B2C e-commerce sales have increased sharply over the last decade, driven by a growing online population and changes in consumer behaviour.
Authored by Heleen Buldeo Rai, last update on October 23rd, 2023 by Camille Horvath
E-commerce is defined by the Organisation for Economic Co-operation and Development (OECD) as “the sale or purchase of goods or services, conducted over computer networks by methods specifically designed for the purpose of receiving or placing of orders. (…) Payment and the ultimate delivery of the goods or services do not have to be conducted online. An e-commerce transaction can be between enterprises, households, individuals, governments and other public or private organisations” (OECD, 2011).
A report published by the United Nations Conference on Trade and Development (UNCTAD) finds that measuring the value of e-commerce remains a challenge. “Although more governments are now collecting information on e-commerce, most countries still do not publish official statistics in this area. Those that publish data on the value of e-commerce sometimes do not follow international guidelines and statistics are often revised.”
Moreover, it is important to consider the distinction between B2C and B2B e-commerce value data. UNCTAD (2021) estimates that the global value of e-commerce sales, including both B2B and B2C transactions, reached almost $26.7 trillion in 2019. This corresponded to about 30% of GDP and represented an increase of 4% from 2018 ($25.6 trillion). The value of global B2B e-commerce was $21.8 trillion, capturing 82% of all e-commerce (UNCTAD, 2021). This difference in value between B2B and B2C e-commerce mainly translates the absolute size of sector, rather than the particular relevance of e-commerce within these sectors (OECD, 2019). Within B2B e-commerce, specifically the manufacturing sector and wholesale trade capture the lion’s share of transactions: these two sectors account for 67% and 85% of turnover in Europe and the United States respectively (OECD, 2019).
The remaining global B2C e-commerce value was $4.9 trillion in 2019, up 11% over 2018 (UNCTAD, 2021). About half of that represents an exchange of goods (as opposed to services). According to CBRE, the global retail market consisted for 91% of offline transactions and 9% of online transactions in 2016. The online retail sector accounted for 20% of the global retail market in 2021. This marks a significant increase from previous years, with e-commerce sales rising by 133% over the past five years alone. The impact of the COVID-19 pandemic has been particularly notable, as there was a 46% increase in global e-commerce sales during the first two years of the outbreak (CBRE, 2022). The current growth in e-commerce sales has been led by B2C transactions for several years now, growing annually by double-digit rates (Ecommerce Foundation, 2019). Despite the challenges posed by the COVID-19 pandemic and some countries reporting lower e-commerce sales, European e-commerce has remained resilient. In fact, in 2021, Europe experienced a notable 16% growth in B2C e-commerce sales (E-commerce Europe, 2022).
A Fevad (2023) report on e-commerce in France reveals that the country's online spending reached (products and services included) 146,9 billion euros in 2022. This marks a 13.8% increase compared to the previous year, but a slight decline from the 15.1% growth seen in 2021. Despite this dip, the e-commerce sector is still experiencing double-digit growth. The number 1 e-commerce company in France, Amazon, reached a total turnover of about 9 billion euros in 2021. It represents a strong increase compared to 2020, which was already an exceptional year for Amazon with 7.3 billion euros in turnover. Amazon's business thrives primarily on its third-party sellers. They account for almost 60% of the site's sales in 2022, compared with 3% at the end of the marketplace's first year of operation in 2003 (Delvallée, 2022). If we consider both categories (products and services) separately, the Fevad (2023) report highlights a 7% decrease in sales of products on the internet since 2021. This decline is attributed to the ongoing impact of the COVID-19 pandemic. However, the drop in product sales has been offset by a significant increase in e-commerce services, with a 36% rise in the past year alone and a 50% increase since 2019. E-commerce sales now account for 12.5% of total product sales, marking a decrease of 1.6% from the previous year (Fevad, 2023).
The 2023 Fevad report also states that approximately 15% of online shoppers are now embracing proximity and short supply chains, making purchases from local retailers and independent producers, driven by motivations such as supporting local businesses (60%), convenience (57%), and a commitment to local consumption (53%). Key online purchases include fashion (56%), travel accommodations (43%), footwear (41%), and transportation tickets (39%). E-commerce serves as a logistics and information facilitator, while also becoming a platform for consumers to enact their commitments, as evidenced by the rise in purchases of reconditioned or second-hand products (52%), particularly among the 15-25 age group. Moreover, over 80% of French consumers now prioritize quality over quantity when shopping online in 2023, with 70% favoring environmentally-conscious websites or those offering made-in-France products.
The table below shows the top ten e-commerce sales countries in the world by 2019, highlighting their B2B and B2C e-commerce sales in billion dollar and the share of B2B e-commerce sales in total e-commerce (UNCTAD, 2021). Although e-commerce data are not always easy to differentiate, this Observatory concentrates on B2C e-commerce of goods (thus excluding services).
E-commerce sales of goods and services, top ten countries in 2019 (UNCTAD, 2021).
Online share of total retail sales and change in e-commerce share (International Post Corporation, 2021).
Accounting for 59% of global internet sales, China and the United States are the biggest e-commerce markets in the world (CBRE, 2022). The top seven markets with the highest e-commerce penetration ratio are South Korea, the United Kingdom, China, Indonesia, the Netherlands, the United States and Canada. The figure by the International Post Corporation (2021) visualises internet sales as a percentage of total retail sales for 2020 as well as the change in e-commerce share between 2019 and 2020, in various countries around the world.
The table below shows as well that developing and transition economies account for about half of the top 20 economies by B2C e-commerce sales in 2019 (UNCTAD, 2021). In relation to GDP, B2C e-commerce sales were the largest in Hong Kong, China and the United Kingdom. UNCTAD (2021) estimates that cross-border B2C e-commerce sales amounted to $440 billion in 2019, representing an increase of 9% over 2018. Cross-border sales are estimated to be 9% of total B2C e-commerce sales.
B2C e-commerce sales of goods and services, top 20 economies in 2019 (UNCTAD, 2021). Note: Data for some economies are from supply-side surveys that include overseas sales (exports) but not overseas purchases. Data for other economies are from demand-side surveys that include purchases by consumers from overseas (imports) but not foreign sales by companies. Hence the data are not directly comparable and should therefore be interpreted carefully. Figures in italics refer to 2018.
$540 billion more online home deliveries by 2025 amid COVID-19 shift (Metapack, 2022).
Based on market intelligence and forecast data by Retail Economics, Metapack (2022) predicts online non-food sales for 2025 for the US, UK, France and Germany. In the graphs, it takes the impact of COVID-19 into account. For France the report states that e-commerce is expected to account for 32.3% of total non-food sales by 2025.
Top 10 economies in the UNCTAD B2C E-commerce Index 2020 (UNCTAD, 2021).
Among countries, the extent in which internet-users shop online varies considerably. According to UNCTAD's Business-to-Consumer E-commerce Index 2020, Europe remains by far the most prepared region for e-commerce. The index scores 152 nations on their readiness for online shopping. Countries are scored on access to secure internet servers, reliability of postal services and infrastructure, and the portion of their population that uses the internet and has an account with a financial institution or a provider of mobile money services. As the table above shows, Switzerland leads the index, for the first time, just ahead of the Netherlands (UNCTAD, 2021).
China and the United States, the two largest B2C e-commerce markets in the world, as discussed above, rank 55th and 12th respectively in the index. UNCTAD (2021) states: “Although both countries lead in several absolute measures, they lag in relative comparisons. For instance, internet penetration in the United States is lower than in any of the economies in the top 10, while China ranks 87th in the world on this indicator. As for online shopping penetration, the United States ranks 12th while China takes the 33rd slot.” The extent to which people shop online still differs widely. The graph below visualises online shopping figures around the globe from 2019. The share of internet-users that shop online ranges between 13% and 89%. UNCTAD (2021) estimates that 1.48 billion people, or a little over one quarter of the world’s population aged 15 and older, made purchases online in 2019. This is 7% higher than in 2018.
Share of consumers using the internet who shopped online in 2019 (Ecommerce Foundation, 2019).
UNCTAD (2022) figures show that the significant increase in e-commerce activity fuelled by the COVID-19 pandemic was sustained in 2021, despite easing restrictions in many countries. But the situation prior to the pandemic and the extent of the boost to online shopping experienced vary between countries. Many developed countries already had relatively high levels of online shopping (above 50% of internet users) before the pandemic while most developing countries had a lower uptake of consumer e-commerce.
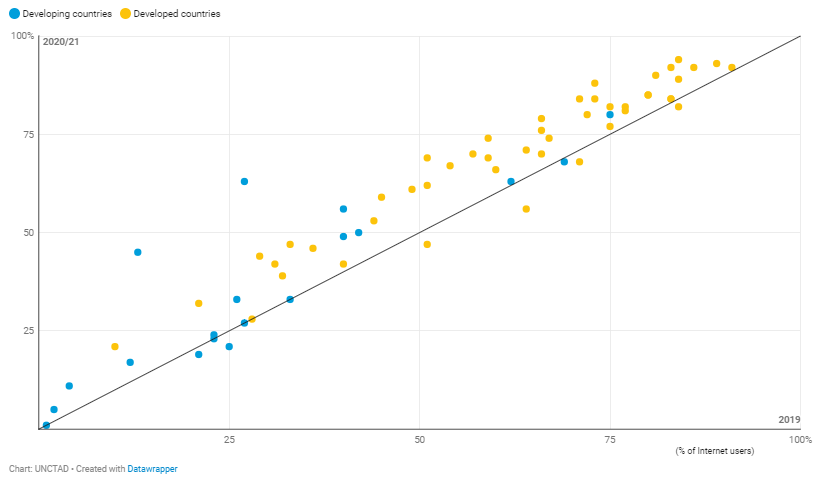
Online shopping before and during the COVID-19 pandemic (percentage of Internet users who made purchases online, 2019 (x-axis) and 2020/21 (y-axis)) (UNCTAD, 2022).
Using Mastercard data from 47 economies, Alcedo et al. (2022) confirm the quick uptake of e-commerce while showing significant heterogeneity among economies. They find that the share of online spending rose more in economies where e-commerce was already large but also that the increase is reversing as the pandemic recedes. Richer economies, where the economic recovery was faster, are closer to the pre-pandemic trends. Meanwhile, economies in later phases of the pandemic, where mobility restrictions are still high, continue to have higher e-commerce penetration.
E-commerce turnover in Europe
In Europe, the majority of Europeans have shopped online (64%), a figure that has continued to grow since 2015. Despite the Covid-19 pandemic leading to many people trying ecommerce for the first time, many still prefer to go to bricks-and-mortar stores. Indeed, between 2021 and 2022, ecommerce revenue growth went into decline in Europe, even as it grew globally (RetailX, 2023).
In the table of selected economies below, overall retail sales declined by 1% in 2020 while online retail grew by 22%. Among these countries, the Republic of Korea had the highest online share of retail trade at 25.9% in 2020, up from 20.8% the year before (UNCTAD, 2021).
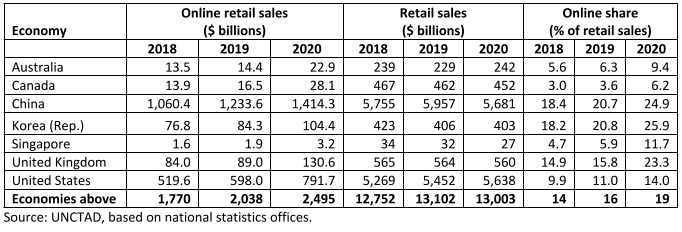
Online retail sales, selected economies, 2018-2020 Economy (UNCTAD, 2021).
In Europe, widespread access to digital technologies and digital services has become the norm for a significant portion, if not the majority, of the population. As of 2022, a remarkable 90% of individuals were connected to the internet, a statistic that soared even higher in many nations, particularly in the affluent regions of Northern and Western Europe. In comparison, the global average for online connectivity stood at 66% in 2022. However, the adoption of e-commerce platforms displays uneven patterns. In Europe during the same year, 64% of internet users engaged in online shopping, surpassing the worldwide average of 49.2%. Despite the pandemic motivating many to explore e-commerce for the first time, a substantial portion of consumers still favor traditional brick-and-mortar stores. Intriguingly, while global e-commerce continued to expand, Europe experienced a decline in e-commerce revenue growth between 2021 and 2022.

Ecommerce revenue growth in Europe (Europe Ecommerce Region Report, 2023)
Turnover growth of B2C e-commerce in Europe shows a widely different picture. Within Europe, disparities in online shopping habits are noticeable across regions. Western Europe, as per Eurostat research, boasts over three-quarters of online users also participating in online shopping. In contrast, Eastern Europe reports a figure just above half of internet users embracing e-commerce, despite an internet penetration rate close to 83% in this region.

Online shopping patterns by country, 2022 (RetailX, 2023)
Across Europe, 74% of respondents are regular online shoppers, with the UK leading at 88%, closely followed by Germany, Spain, and Italy at 79%. In contrast, only 56% of Norwegians fall into the regular online shopping category, defying expectations. Surprisingly, Romania, a less economically developed nation, records a substantial 69% of regular online shoppers, according to the Europe Ecommerce Region Report (2023).

Monthly online spending by country in 2022 (RetailX, 2023)
Across Europe, 40% of respondents spend between €12 and €120 per month on online shopping, with notable variations such as 28% in Sweden and 50% in Portugal falling within this range. Particularly intriguing are the findings concerning those spending over €1,200 monthly, comprising 8% of respondents in Sweden and 7% in both Norway and France. Further research is needed to ascertain whether this is due to extensive online shopping or a presence of affluent customers purchasing luxury items.
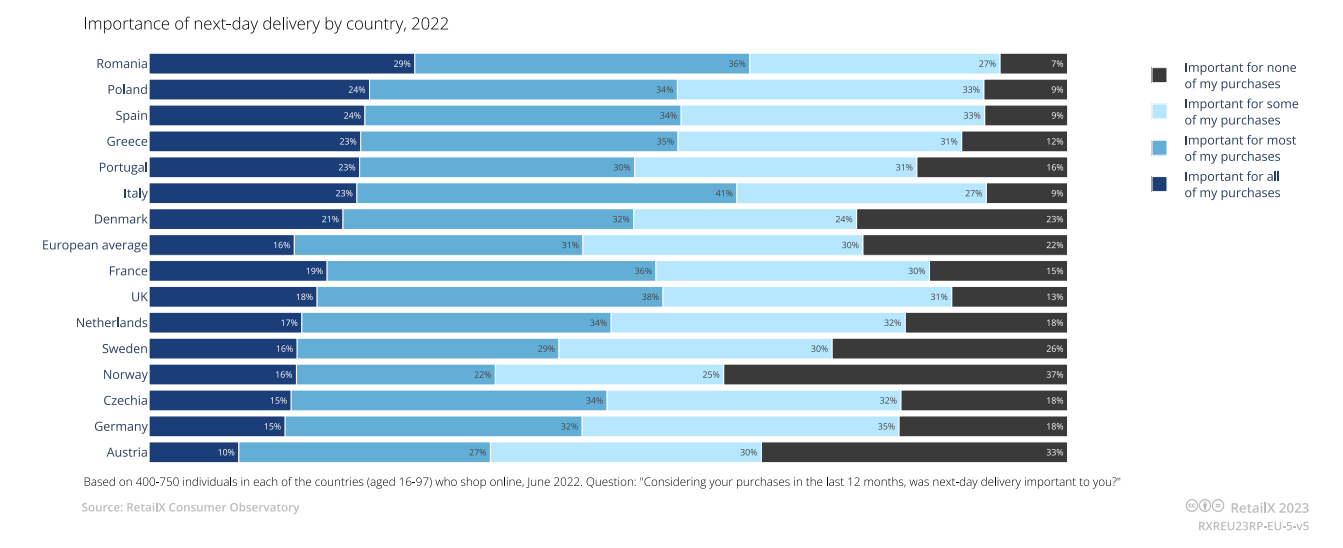
Importance of next-day delivery by country in 2022 (RetailX, 2023)
Research on next-day delivery reveals a nuanced perspective on its importance. In Europe, 16% of respondents prioritize next-day delivery for all purchases, with an additional 31% considering it crucial for some of their buys. Country-wise, Austria stands out, with 33% of respondents deeming next-day delivery unimportant.
The share of companies that participate in e-commerce sales has grown in most of the OECD area and some other countries, from an average of 16% in 2008 to about 23% in 2017. New Zealand and Australia had a particularly high share of e-commerce firms (above 40%) in 2017, explained in part by a large geographical distance from other countries, high Internet penetration and high-quality communications infrastructures (OECD, 2019). In Europe, regardless of their size, the penetration of e-commerce among companies progresses.
The figure below show that 22.8% of EU27 companies sold online in 2021, which is a moderate increase compared with 16.4% in 2012 (Eurostat, 2023). Almost half of large companies have an e-commerce extension, while this is only the case for 20.8% of small companies. Among the EU member states, conducting e-commerce sales is most common for companies in Ireland (42%), Sweden (38%) and Lithuania (37%). The enterprises' turnover generated from e-sales increased by 4.5 percentage points since 2012, namely from 13.1 % to 17.6 %, although the turnover recorded in 2021 decreased by 2.2 percentage points compared to 2020 (Eurostat, 2023).
E-commerce sales of goods and services and turnover by size class for the EU27 by 2021 (Eurostat, 2023). Note: % enterprises, % total turnover.
References
Alcedo, J., Cavallo, A., Dwyer, B., Mishra, P., & Spilimbergo, A. (2022). E-commerce During Covid: Stylized Facts from 47 Economies. In National Bureau of Economic Research Working Paper Series: Vol. No. 29729. http://www.nber.org/papers/w29729%0Ahttp://www.nber.org/papers/w29729.pdf
CBRE (2022). CBRE Global E-commerce Outlook 2021. https://www.cbre.com/insights/reports/global-e-commerce-outlook-2022
Delvallée, J. (2022). 9 milliards d'€ de chiffre d'affaires... Amazon dévoile ses chiffres clés en France, LSA Commerce Connecté. https://www.lsa-conso.fr/amazon-devoile-ses-chiffres-cles-en-france,420641#xtor=EREC-87&email=heleen.buldeo-rai@univ-eiffel.fr
Ecommerce Foundation (2019). Ecommerce Report: Global 2019.
Ecommerce Europe (2023). European e-commerce report 2023. https://ecommerce-europe.eu/wp-content/uploads/2022/06/CMI2022_FullVersion_LIGHT_v2.pdf
Eurostat. (2023) E-commerce statistics. https://ec.europa.eu/eurostat/statistics-explained/index.php?title=E-commerce_statistics#E-sales_record_a_slight_increase_over_recent_years
Metapack (2022). Ecommerce Delivery Benchmark Report 2022. https://info.metapack.com/ecommerce-delivery-benchmark-report-2022.html
OECD. (2011) OECD Guide to Measuring the Information Society 2011. https://books.google.fr/books?...
OECD. (2019) Unpacking E-commerce - Business models, trends and policies. https://doi.org/10.1787/23561431-en
Fevad (2023). Bilan du e-commerce en France : Les Français ont dépensé près de 147 milliards d’euros sur internet en 2022. https://www.fevad.com/bilan-du-e-commerce-en-france-les-francais-ont-depense-pres-de-147-milliards-deuros-sur-internet-en-2022/
Fevad (2023). Chiffres clés e-commerce 2023. https://www.calameo.com/read/00713514555800f19ece5
RetailX (2020). Europe 2020 Ecommerce Region Report.
International Post Corporation (2021). Global Postal Industry Report 2021 - A global review of industry performance and trends.
UNCTAD (2020). UNCTAD estimates of global e-commerce 2018: UNCTAD Technical Notes on ICT for Development N°15. https://unctad.org/en/PublicationsLibrary/tn_unctad_ict4d12_en.pdf
UNCTAD (2021). Estimates of global e-commerce 2019 and preliminary assessment of covid-19 impact on online retail 2020. https://unctad.org/system/files/official-document/tn_unctad_ict4d18_en.pdf
UNCTAD (2021). Switzerland climbs to top of global e-commerce index. https://unctad.org/news/switzerland-climbs-top-global-e-commerce-index
UNCTAD. (2022, April 25). COVID-19 boost to e-commerce sustained into 2021, new UNCTAD figures show. https://unctad.org/news/covid-19-boost-e-commerce-sustained-2021-new-unctad-figures-show